K-Means Clustering
What is K-Means
Need to cluster some data? K-Means is one of the most common and simplistic clustering algorithms. It works by partitioning a data set into K different groups (clusters). In this post, we’ll walk through the basics of K-Means, explain how it works, and touch on some of its strengths and weaknesses.
The Input
The input to K-Means is a set of data and a parameter K, which defines the number of clusters to partition the data into. Each input observation is a vector in d-dimensional space. The number of dimensions doesn’t matter.
The Algorithm
The goal of the K-Means algorithm is to find a partitioning of the input data that minimizes within-cluster sum of squares (WCSS). Simply put, the goal is to find a clustering such that the points in each cluster are close together. This objective function (we’ll call it $J$) can be expressed as:
Here, $K$ is the number of clusters, $N$ is the number of points, $\mu_k$ is the cluster centroid for cluster $k$, and $x_i$ corresponds to input observation $i$. Informally, this function computes the variance of the observations around each cluster centroid (for a given set of K centroids). The goal is the minimize this function. Each iteration of the K-Means algorithm reduces the objective function, moving closer to a minimum.
K-Means uses an Expectation Maximization approach to partition the input data and minimize the WCSS. Conceptually, we start with an initial set of cluster centroids (with an implicitly defined WCSS score). The goal is to figure out how to move these centroids around to make the WCSS score as small as possible. The algorithm can be expressed as
1. Initialize cluster centroids
while not converged:
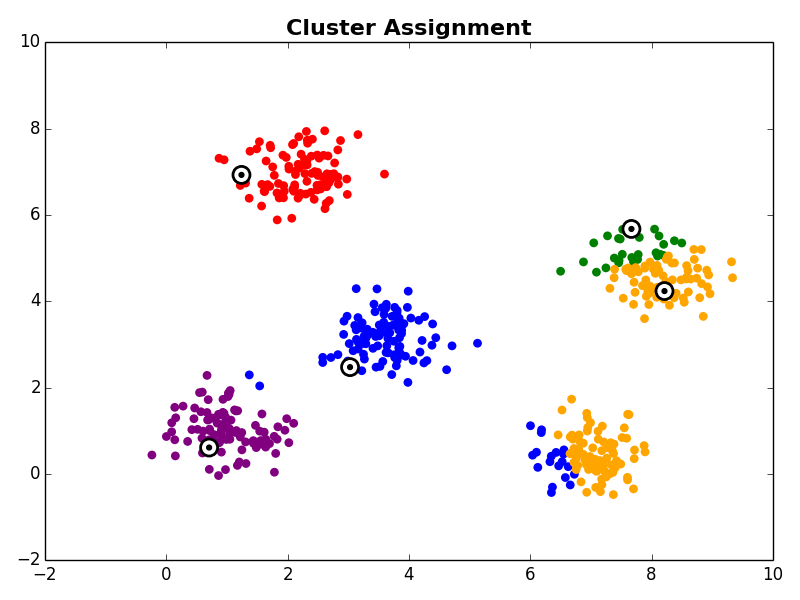
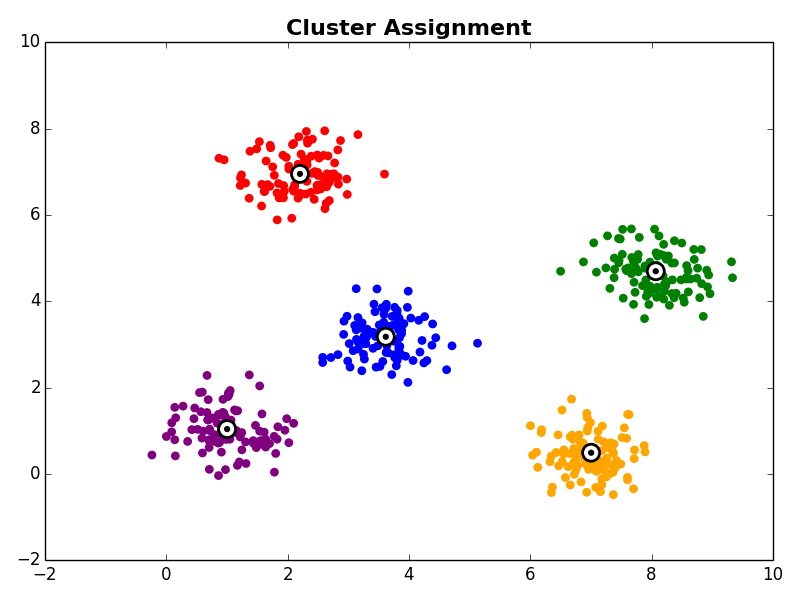
    2. Cluster Assignment - assign each observation to the nearest cluster centroid
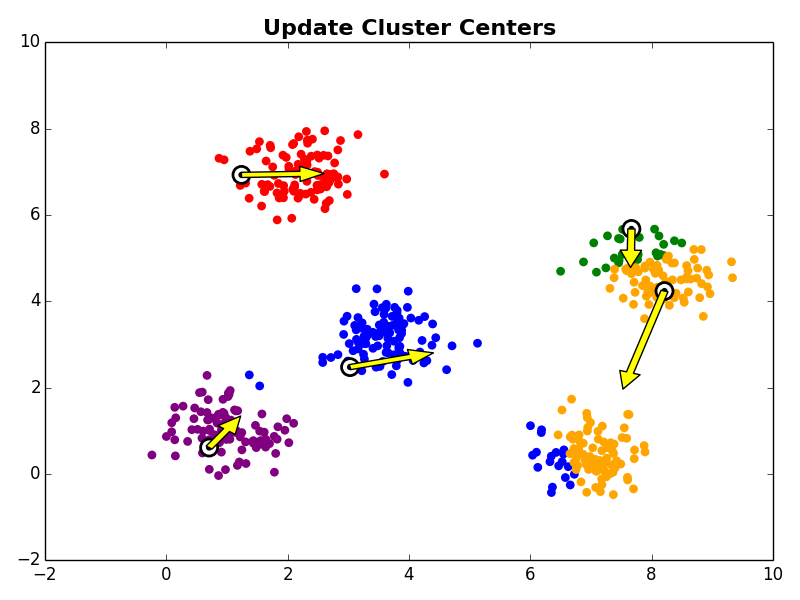
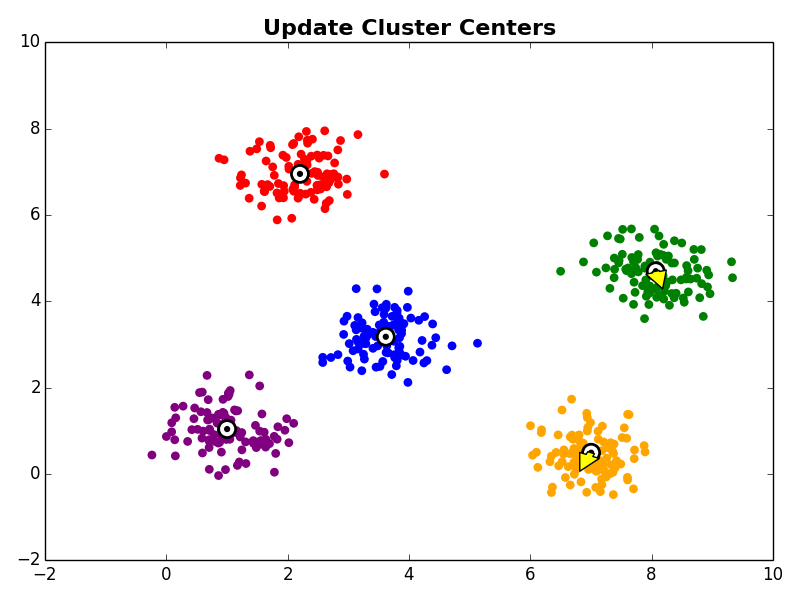
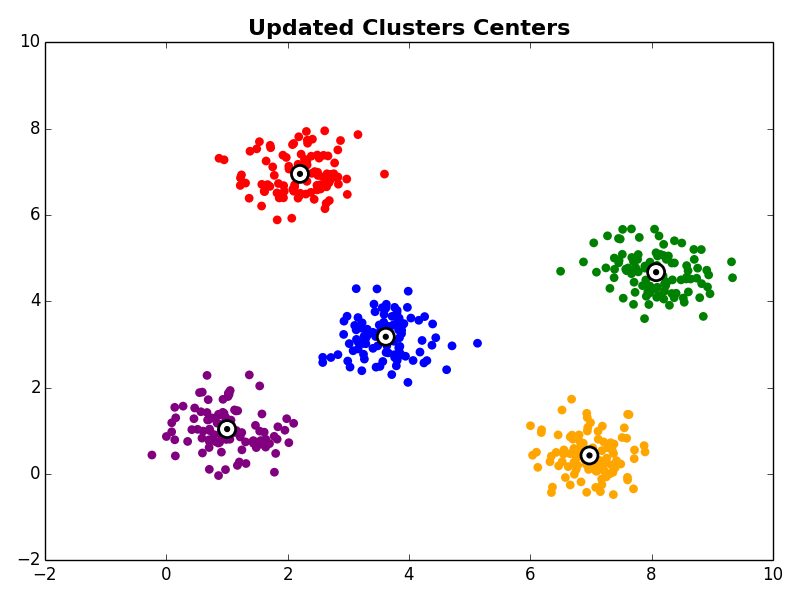
    3. Update Centroids - update the cluster centroid locations
Let’s go over each of these steps.
1. Initialize Cluter Centroids
The first step is to choose an initial set of K cluster centroid locations. This can be done many ways. One approach is to choose K random locations in whatever dimensional space you’re working in. This approach may work, but in practice it may be difficult to choose these locations well. For example, it’s undesirable to choose locations very far away from any of the data. Another, perhaps better, approach is to choose K random observations from the input dataset.
2. Cluster Assignment
In the cluster assignment step each observation in the dataset is assigned to a cluster centroid. This is done by assigning each observation to it’s nearest centroid.
3. Cluster Centroid Update
Next, in the cluster centroid update step, each cluster centroid is updated to be the center (e.g., mean) of the observations assigned to it.
Steps 2 and 3 are repeated until the algorithm converges. There are a few commonly used ways to determine convergence.
- Fixed Iteration Number - K-Means can be terminated after running for a fixed number of iterations. Obviously, this approach does not guarantee that the algorithm has converged, but can be useful when an approximate solution is sufficient, or termination is difficult to detect.
- No Cluster Assignment Changes - This is the most common approach. If no observations change cluster membership between iterations, this indicates that the algorithm will not continue further, and can be terminated.
- Error Threshold - An error threshold can also be used to terminate the algorithm. However, choosing a good threshold is problem and domain specific (e.g., a threshold that works well for one application may not work well for another).
Example
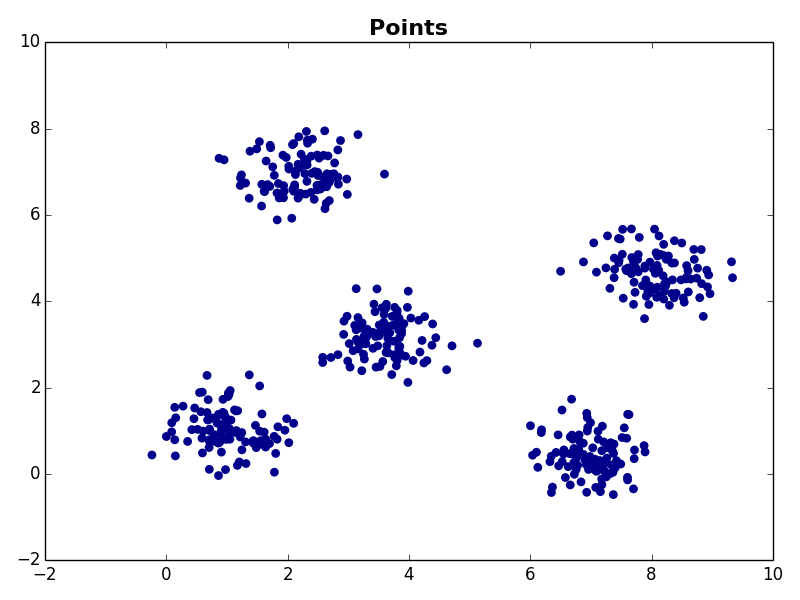
K-Means is often best understood visually, so let’s walk through an example. Suppose you have the following data in two dimensional space.
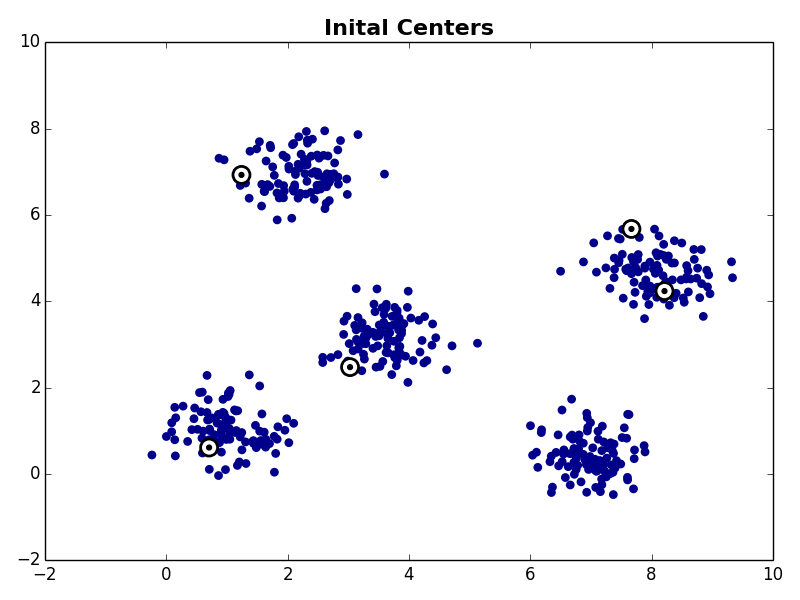
The first step is to choose K starting cluster centers. For our example we will set K=5. For our example we’ll randomly select five observations from our data set to be the initial cluster centroids:
With the initial cluster centroids selected, steps 2 and 3 are iterated as described above.
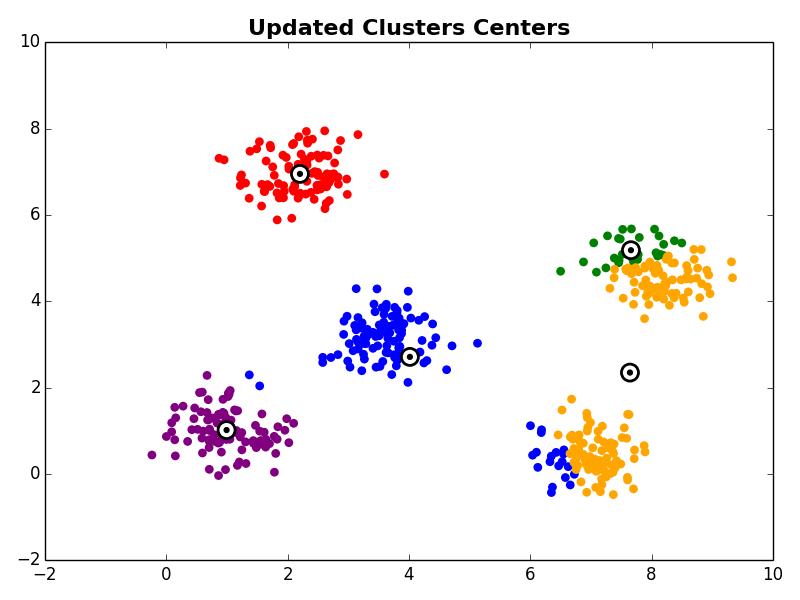
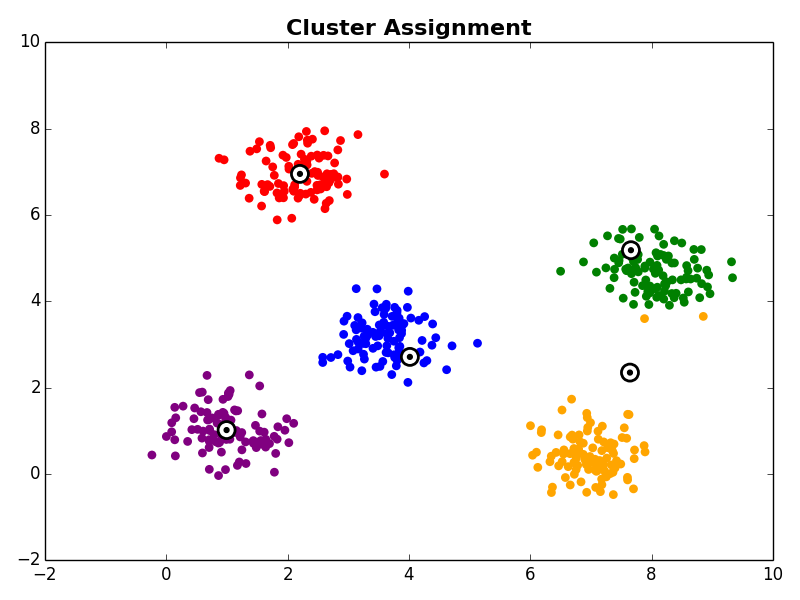
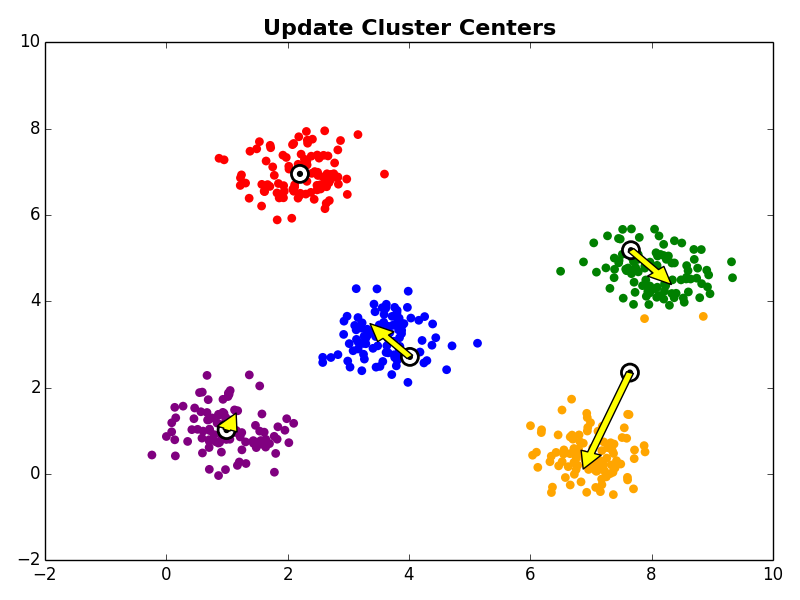
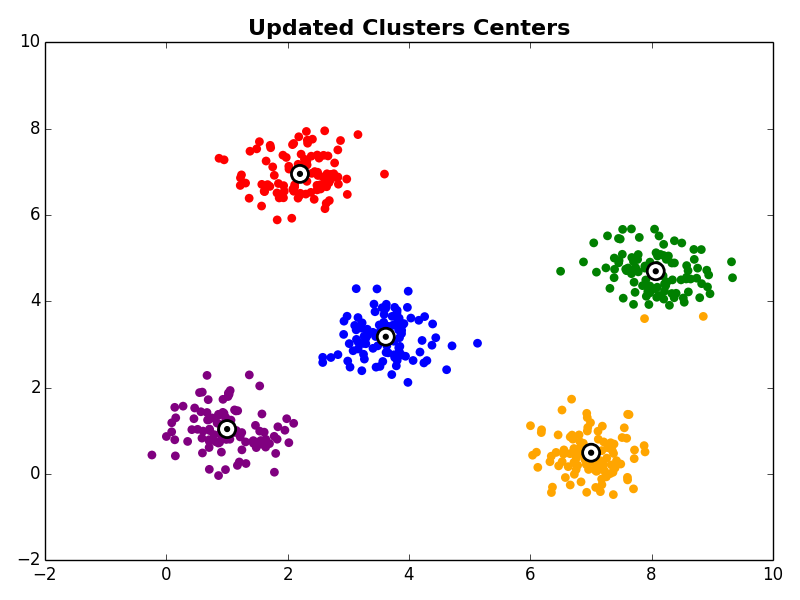
Other Comments
Repeated Runs
It’s very important to note that K-Means is notorious for getting stuck in local minima. This means that there is no guarantee that running K-Means will actually find the optimal solution for a given starting point (set of initial cluster centroids). To overcome this, K-Means is often run multiple times with different initial cluster centroids, and the clustering with the lowest error (WCSS) is chosen.
Choosing K
This video from Andrew Ng’s Machine Learning course on Coursera does a great job summarizing the task of choosing K. In general, there is no great general purpose method. Choosing K often requires manual input based on data visualizaiton or other domain knowledge. Interestingly, for some applications, K may already be known. The T-Shirt sizing example in the video is a great example of this. For these types of problems the goal is to partition the data into a pre-defined number of sets, rather than learning how many distinct sub-sets make up the original input data.
Strengths and Weaknesses
Strengths: K-Means is great because it’s simple and fast. There are several off the shelf implementations available on the internet, and if they’re not good enough, it’s not terribly difficult to implement K-Means on your own.
Weaknesses:The main weakness of K-Means is that it doesn’t work that well for non-spherical clusters. Also, as we discussed earlier, it’s also notorius for getting stuck in local minima, and requires the user to choose K.